One of the most common business cases that clients come to us with is needing more insights into their sales. Understanding sales performance, margin, and costs associated with particular customers and processes has the power to impact how their team will line up their sales strategy for the next period.
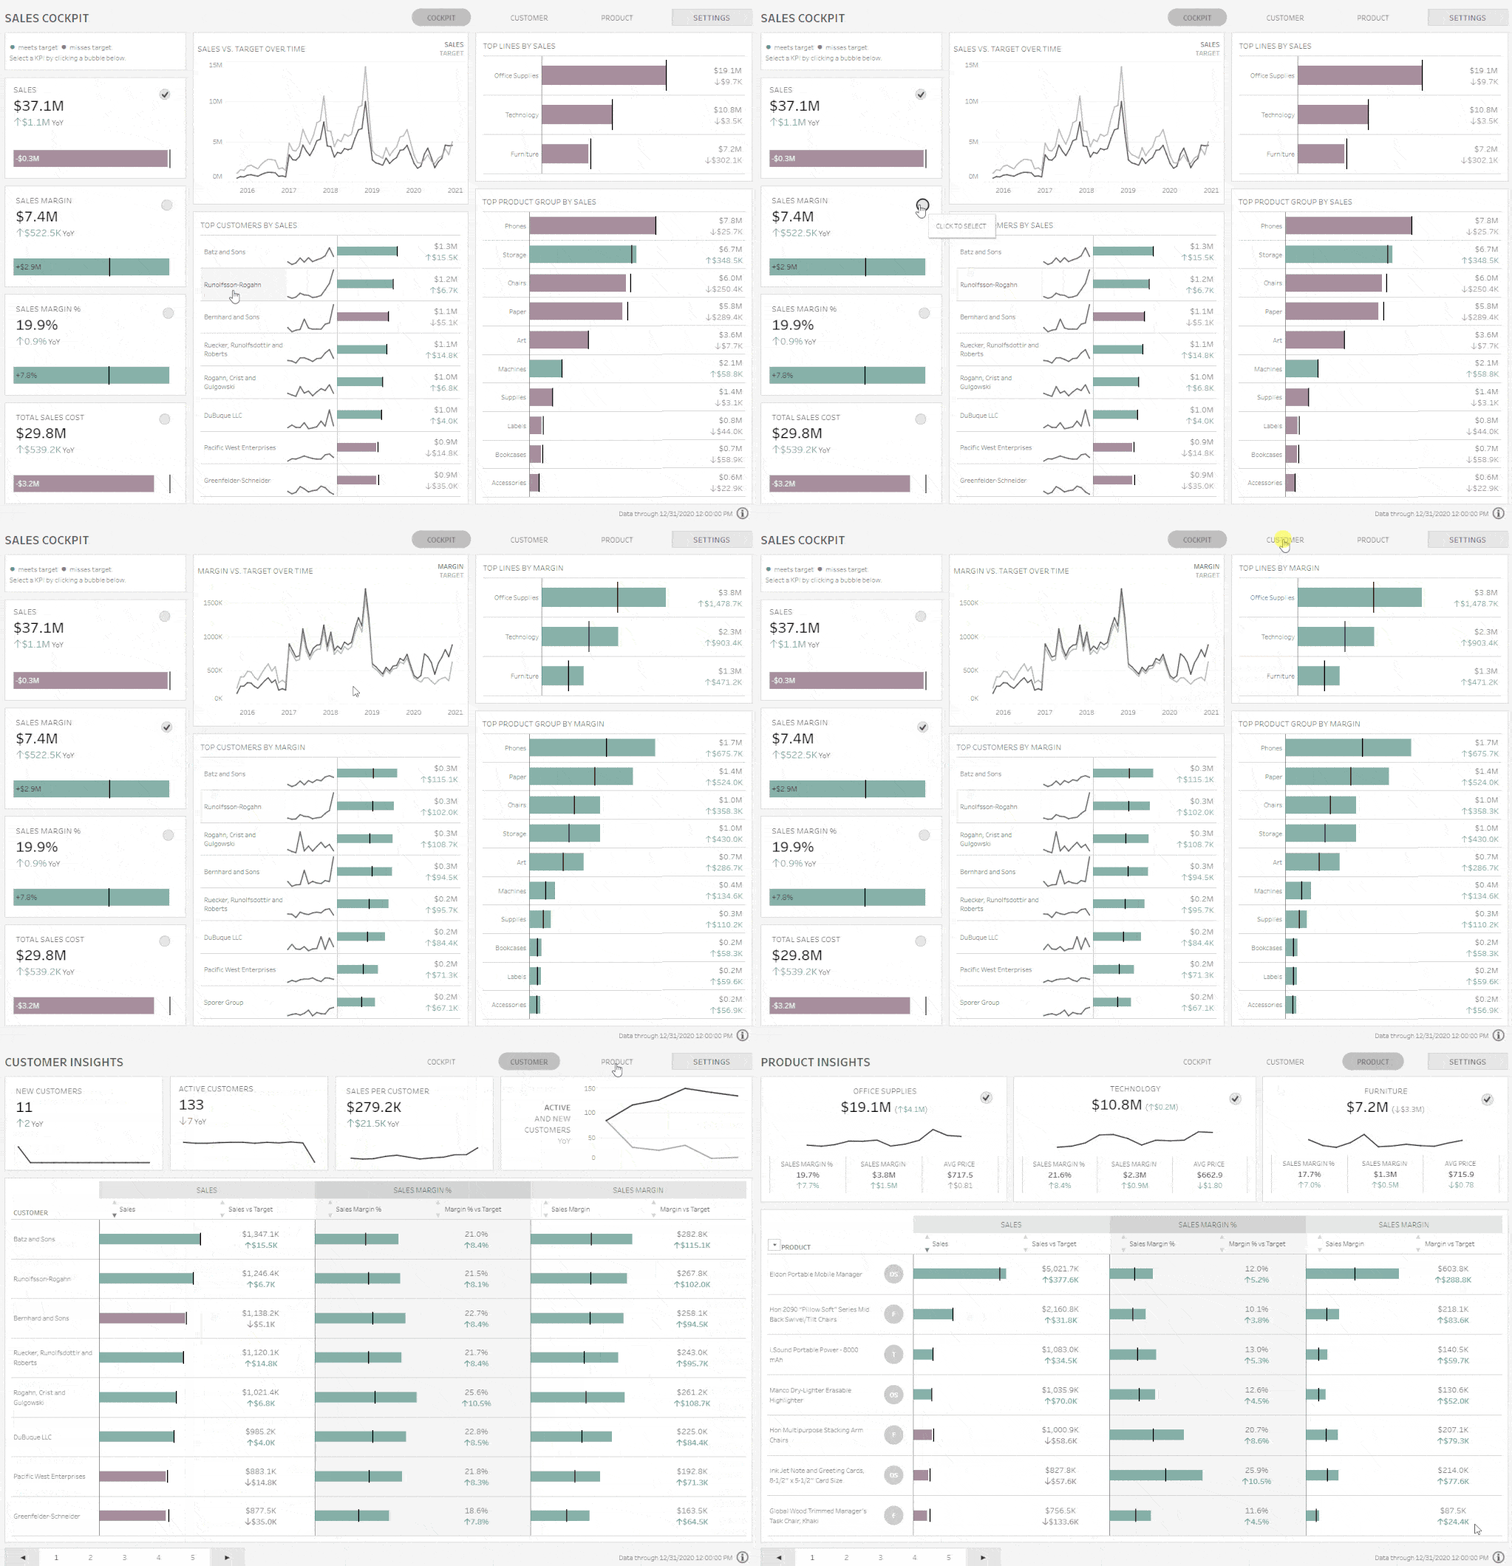
Sales are critical to a business’s success, so we created this sales vs. target Tableau dashboard to help kickstart that analysis.
This dashboard is meant for sales leaders looking to understand the sales performance of their products and customers in comparison to their sales target. Understanding past and current performances, especially against the goals we set for them, helps drive decisions in how we approach sales and who we sell to moving forward.
This dashboard allows you to identify top (and bottom) performers based on critical metrics like sales, sales margin, and sales cost — all versus a target set for the metric. This Tableau dashboard will help you answer questions like:
The answers to these simple questions have the power to impact how the team will line up their sales strategy for the next period.
If a target is not set, you can also compare these metrics vs. a previous period: Last Year or Last Month. This gives the user flexibility to better understand not only the metrics vs. targets but also trends in historical performance.
We hope you found this dashboard useful in your pursuit to better identify top performers within your company and see whether the teams are hitting sales targets.
If you have any questions, need help, or are interested in having a team of Tableau experts design dashboards for you, feel free to reach out!
Subscribe to our newsletter

Data Coach is our premium analytics training program with one-on-one coaching from renowned experts.