The ability to filter dashboards is one of the top requirements in developing business dashboards. If there is a way to slice the data you can almost guarantee that a stakeholder will list that as a “must-have”. In cases where you have multiple filters, can select more than one option in a list, or apply filters across multiple dashboards, dynamic titling can be a helpful tool.
Writing a descriptive and clear dashboard and worksheet tiles is an effective way to reduce the time for users to understand your charts and move quickly to gain insights. For example, when filtered by transportation type, a chart title of “Transportation Costs over Time” is less clear than “First-Class Mail Costs over Time”. Although a small detail, these touches unconsciously improve the user experience. There are several ways to create titles in Tableau dynamically. This blog post uses filter actions and the COUNTD (Count Distinct) function.
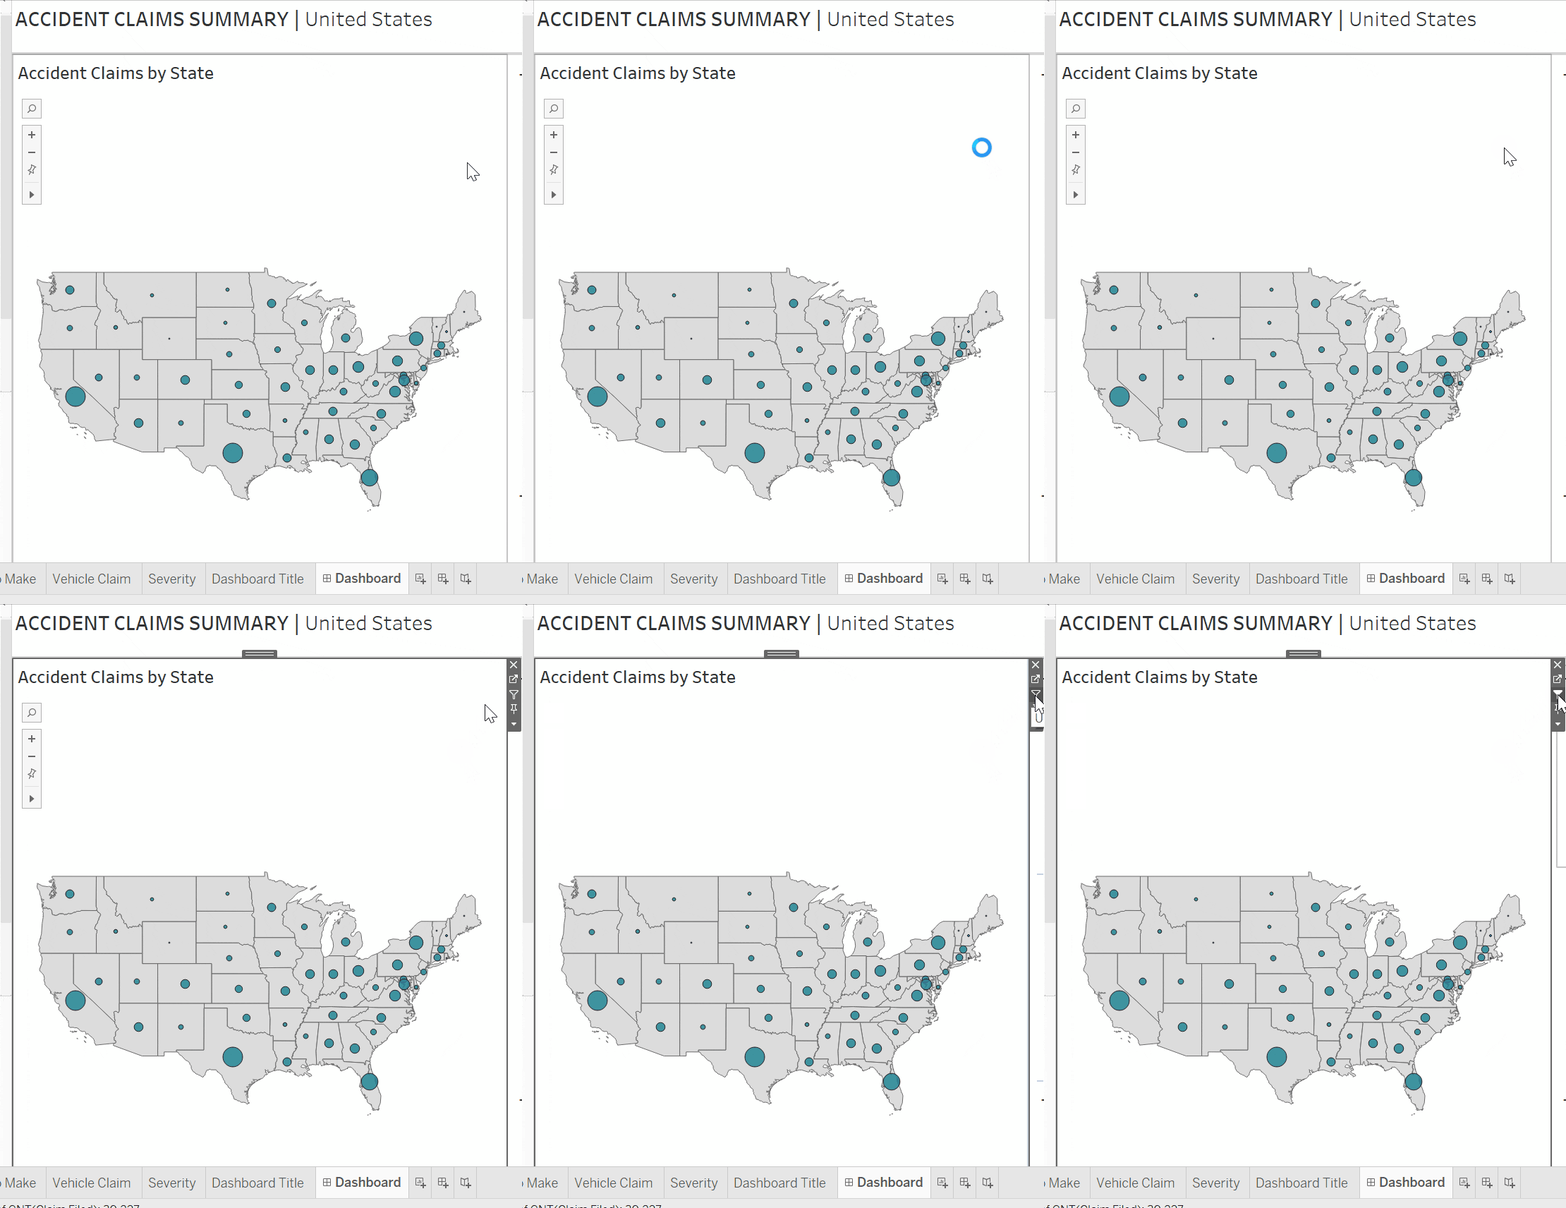
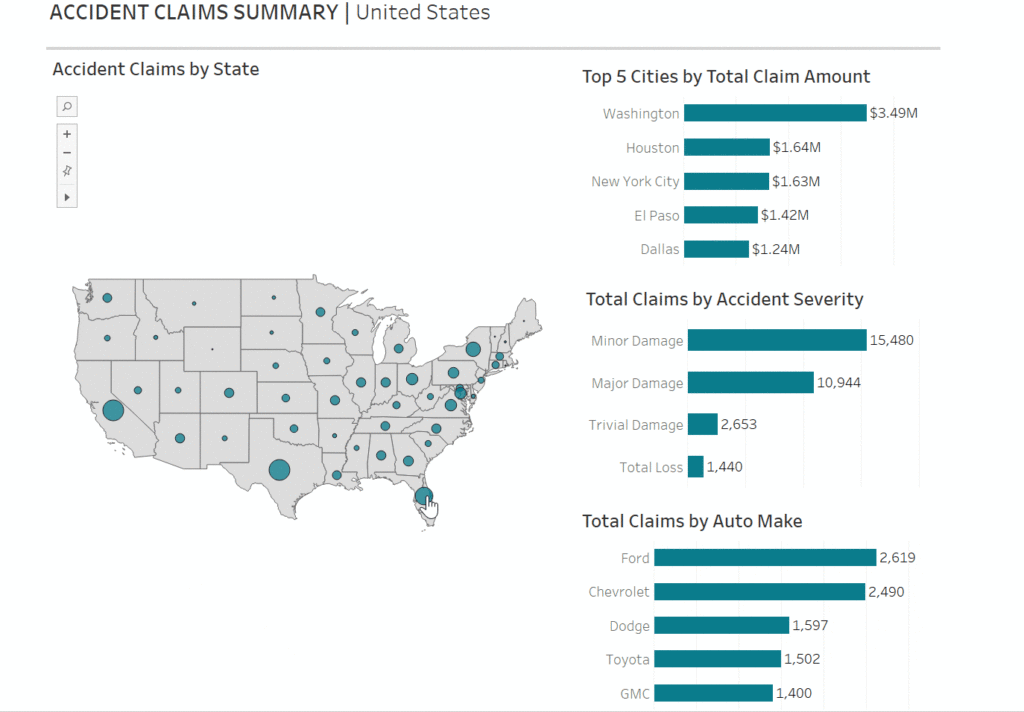
In this dashboard, when the user selects one or more states on the map, the bar graphs filter to show the selected state(s) data. As a visual cue to the user, we will update the current dashboard title to “Accident Claims Summary | <Selected State> ” when one state is selected. When two or more states are selected, we will insert “Multiple States,” and when unfiltered, we will use “United States”.

Create Dynamic Title Calculated Field
First, create your calculated field. The key to this is to use an aggregate function such as MIN, MAX or ATTR to fix the cannot mix aggregate and non-aggregate comparison error.
IF COUNTD([State]) = 1 THEN MIN([State])
ELSEIF COUNTD([State]) = MIN({COUNTD([State])}) THEN “United States”
ELSE
“Multiple States”
END

Creating a New Worksheet as Dashboard Title
Create a new worksheet and place the new calculated field on the Text marks card. Make sure this calculated field is placed to the right of the hard-coded text. This worksheet will serve as the new dashboard title.

Adding Dynamic Title and Filter Action to Dashboard
Add this worksheet to the top of the dashboard. The dashboard title should read “ACCIDENT CLAIMS SUMMARY | United States”. Select the map worksheet and click on the filter icon to add the filter action to all the worksheets.


