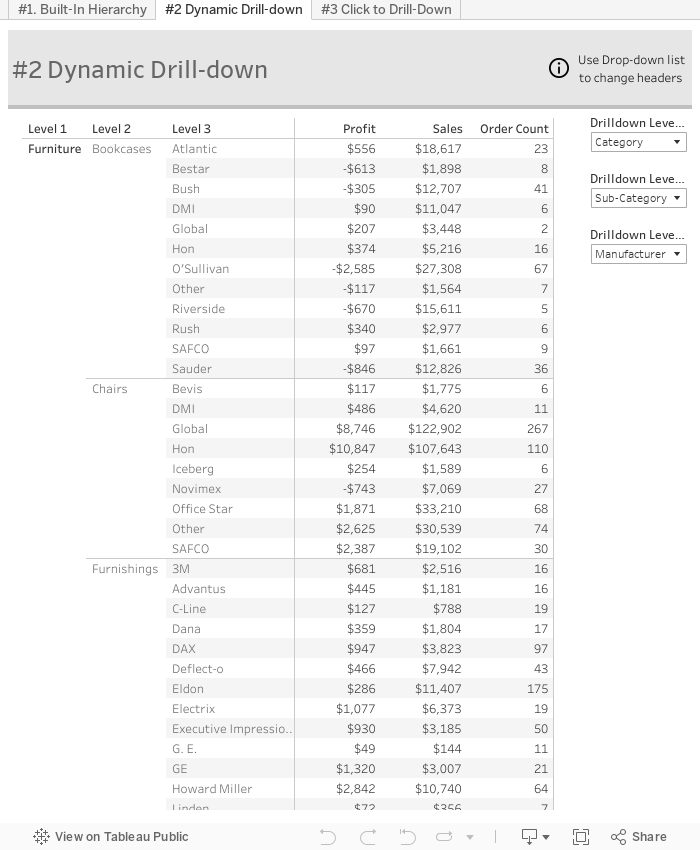
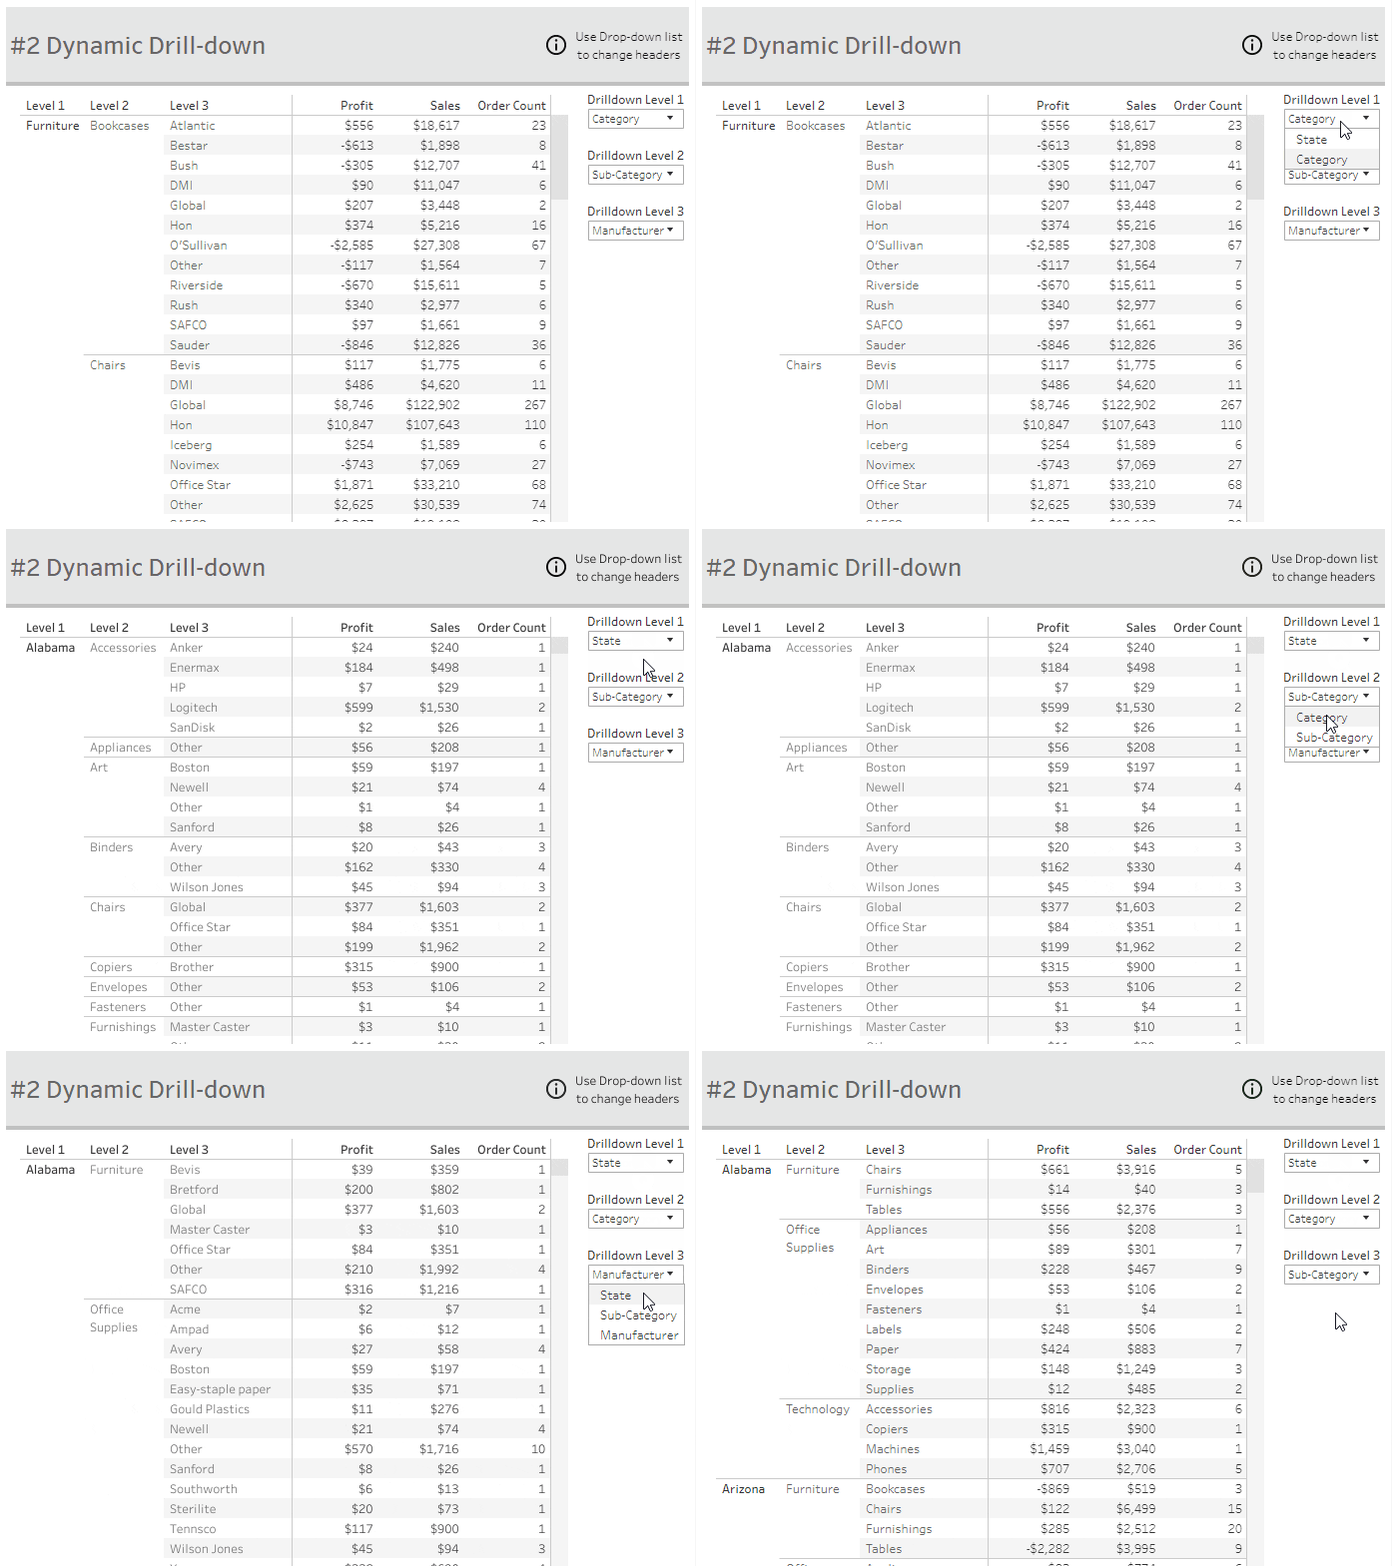
This option is great for situations where the drill-down path might not always be the same.
For this example, we are going to create two drill-down paths :
Category > Sub-Category > Product Name
State > Category > Manufacturer
Step #1: Create Level Parameters
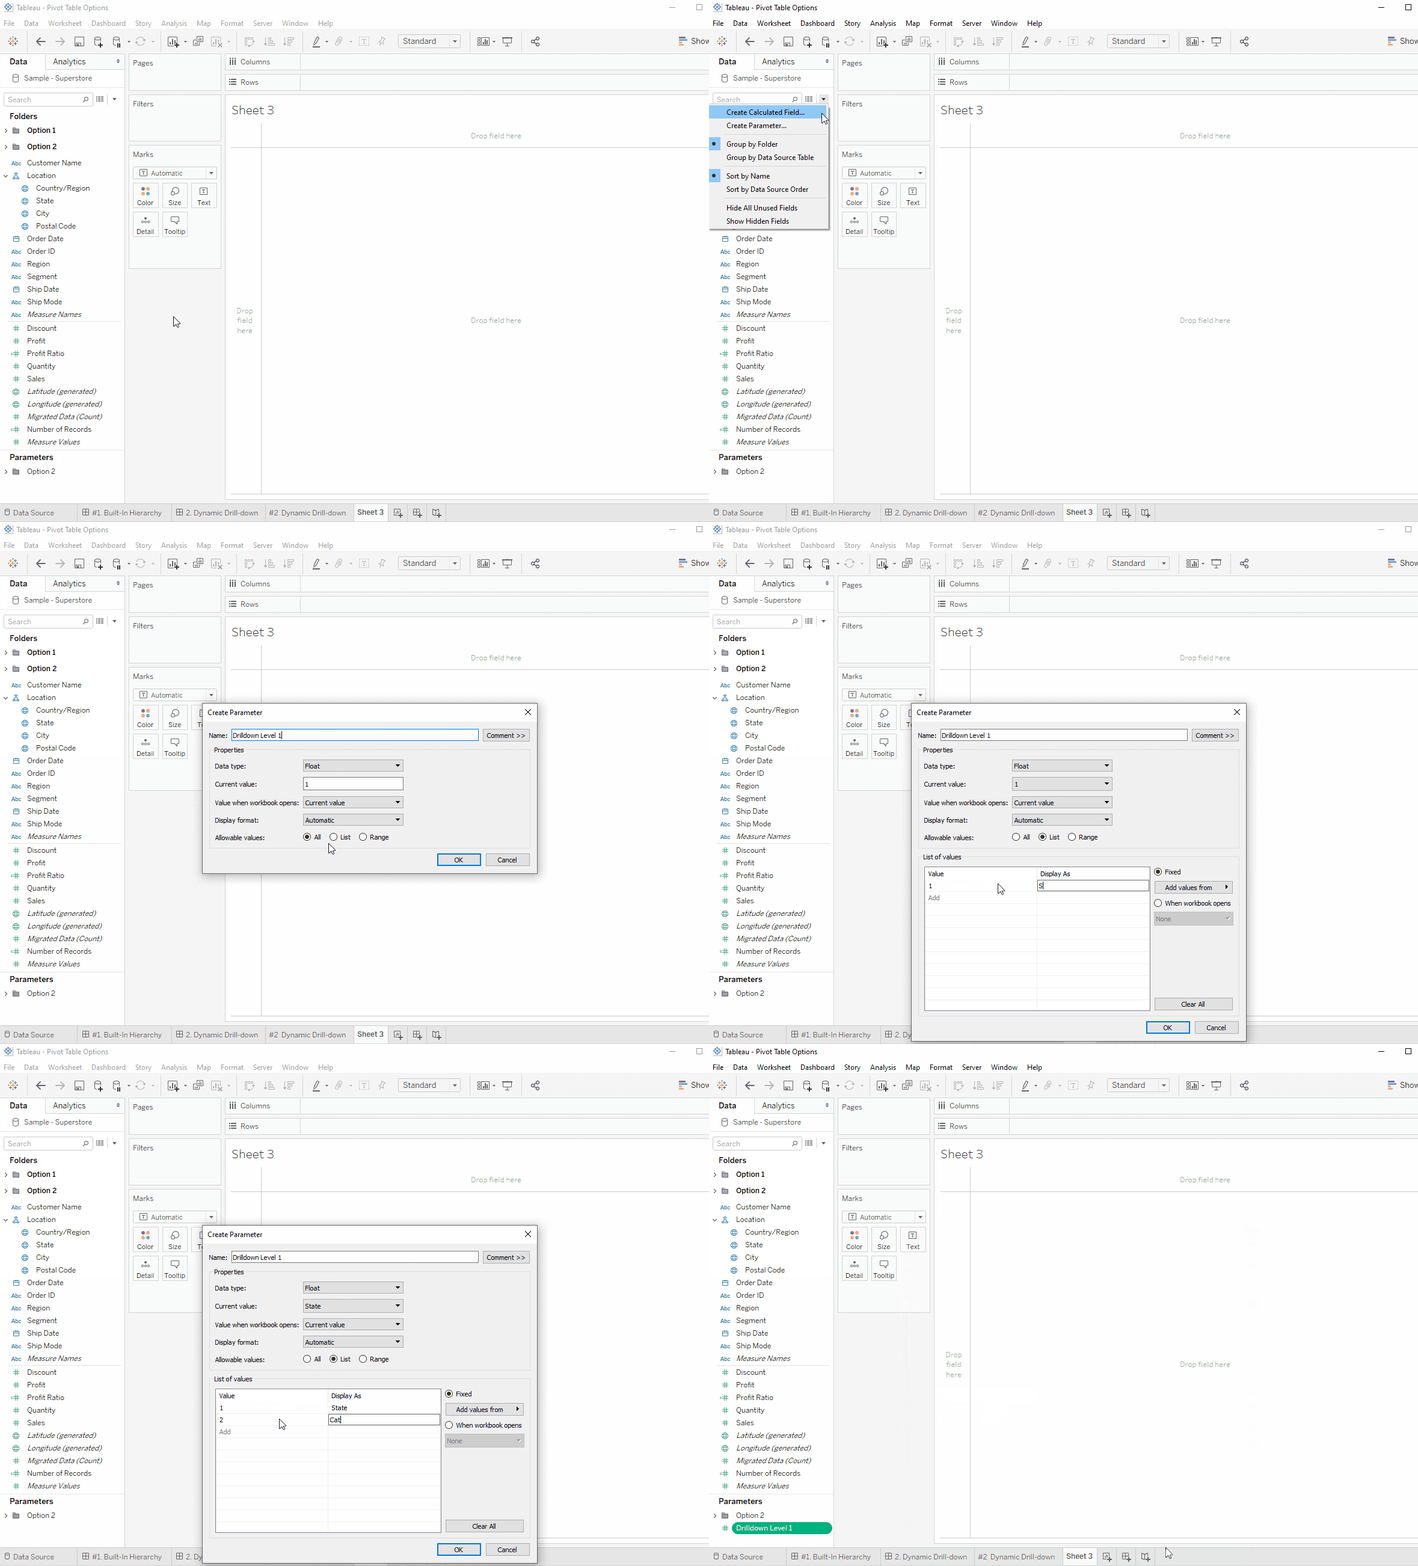
Create a Parameter that lists the options for Level 1.
Repeat for each drill-down level.
Step #2: Create Display Formulas
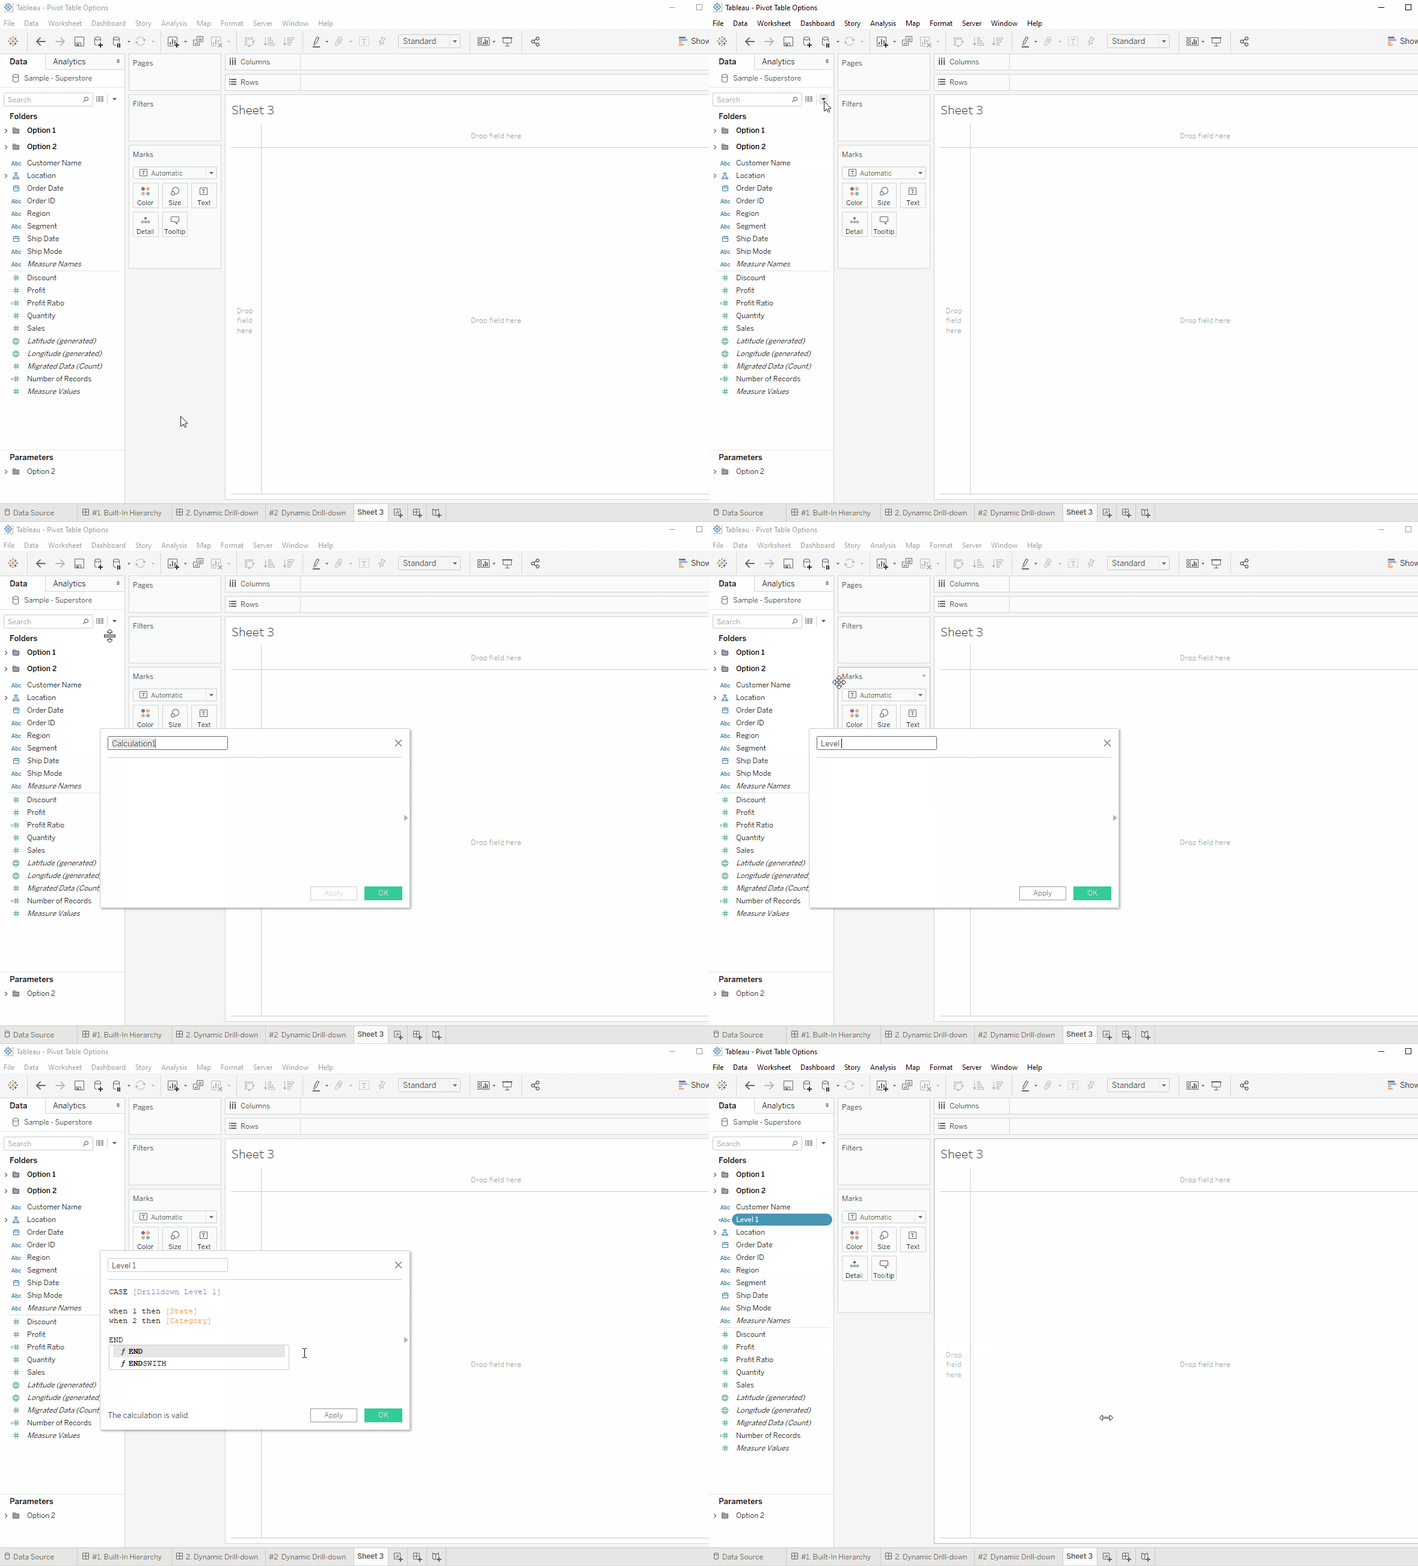
Create a calculated field that identifies the field that should be displayed based on each level’s parameter selection.
Repeat for all levels.
Step #3: Create Viz
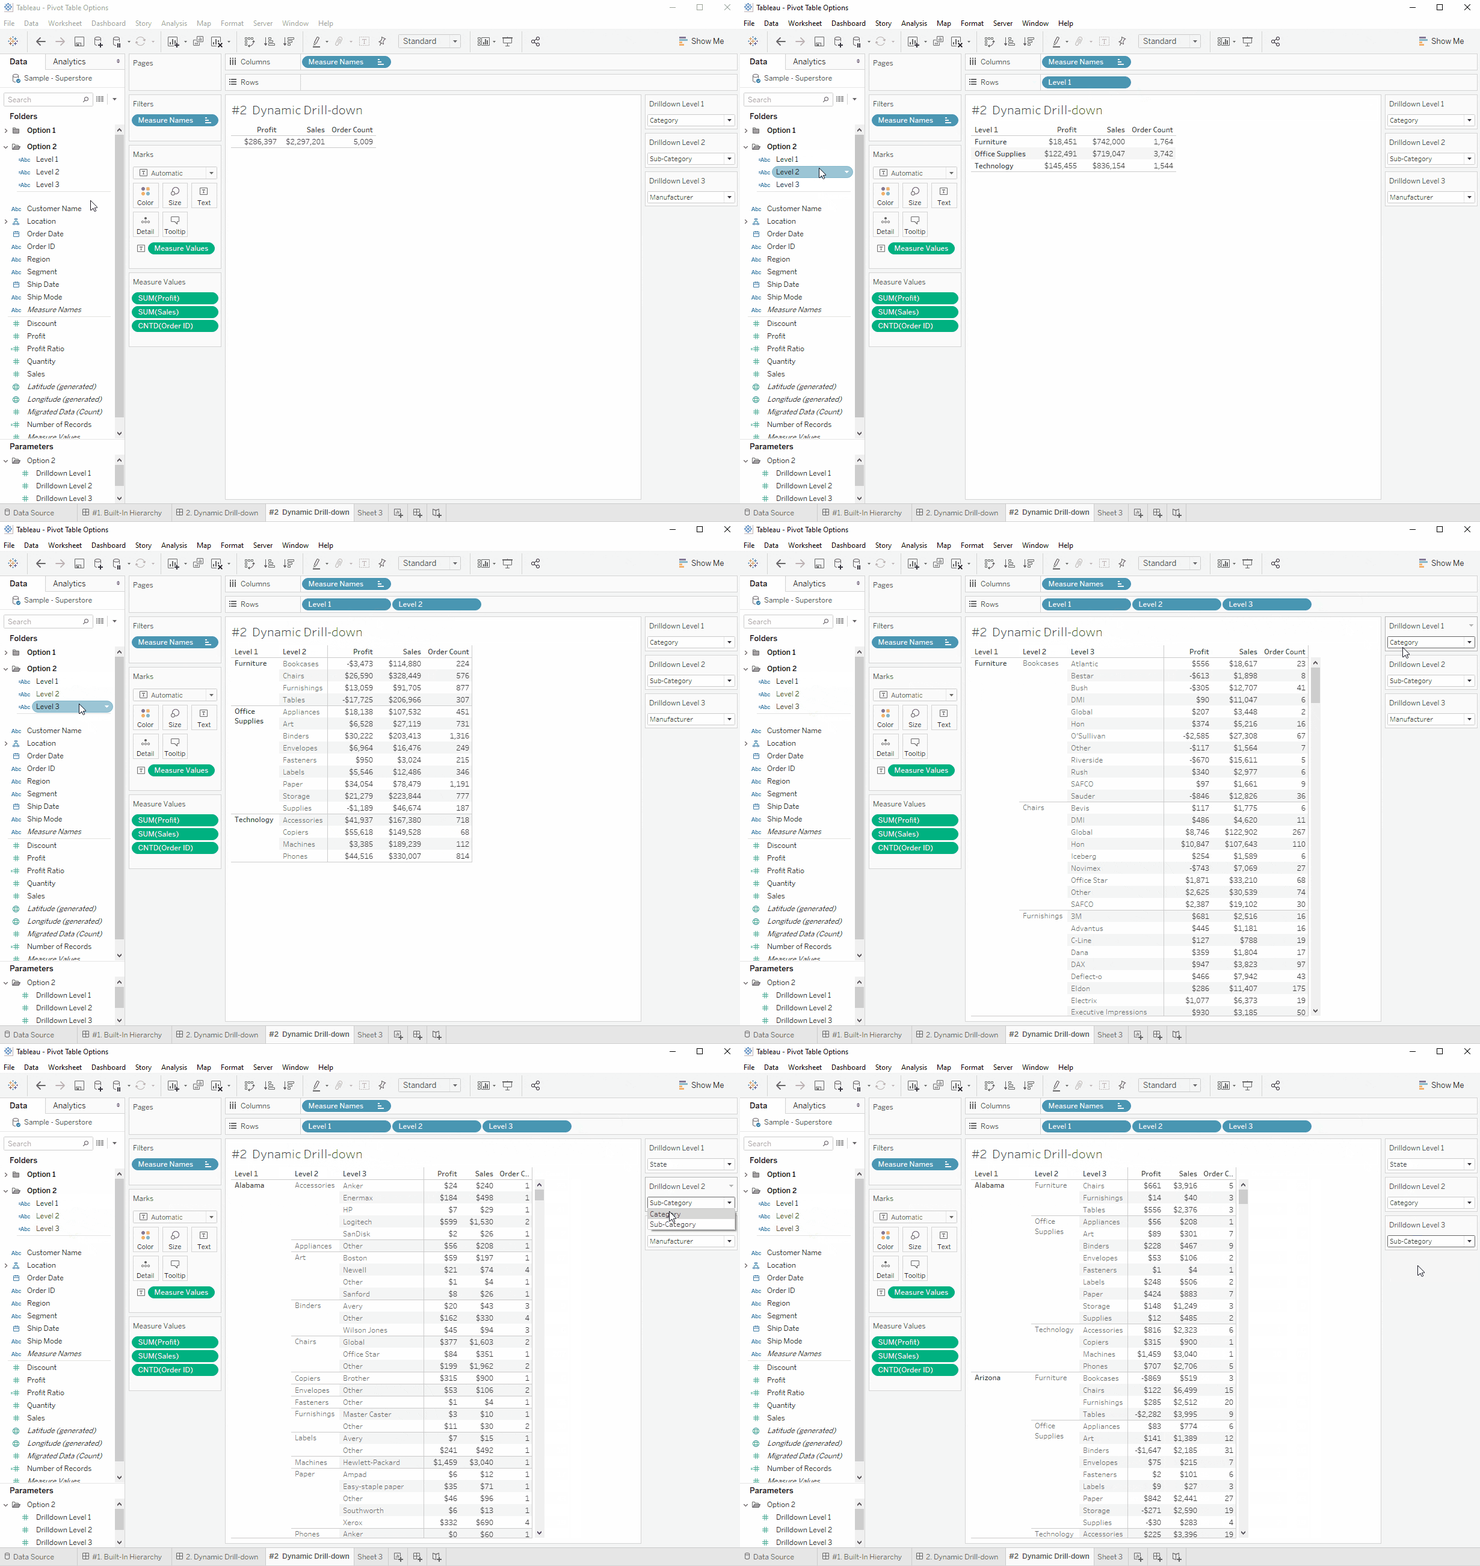
The last step is to add the Level calculations to the sheet.
Step #4: Formatting and Final Touches
Once your sheet is on a dashboard, I suggest adding instructions for the end-user. It is also a good idea to test the sizing of the columns and rows to make sure the data is clearly displayed when the levels change.